Environment
St. Albert is committed to maintaining a healthy and sustainable environment. The following data provides information on the City’s environmental efforts.
Indicators
Landfill Diversion Rate
Measures residential waste that is being diverted from going to the landfill by being processed by recycling or compost facilities.
Reporting frequency: Quarterly Last updated: Q4, 2019
Comments
The diversion rate may have been impacted since the Blue Recycling Bag program changes were launched on November 1, 2018. Bags with unacceptable materials were not collected and residents had to re-sort the items into the garbage or organics.
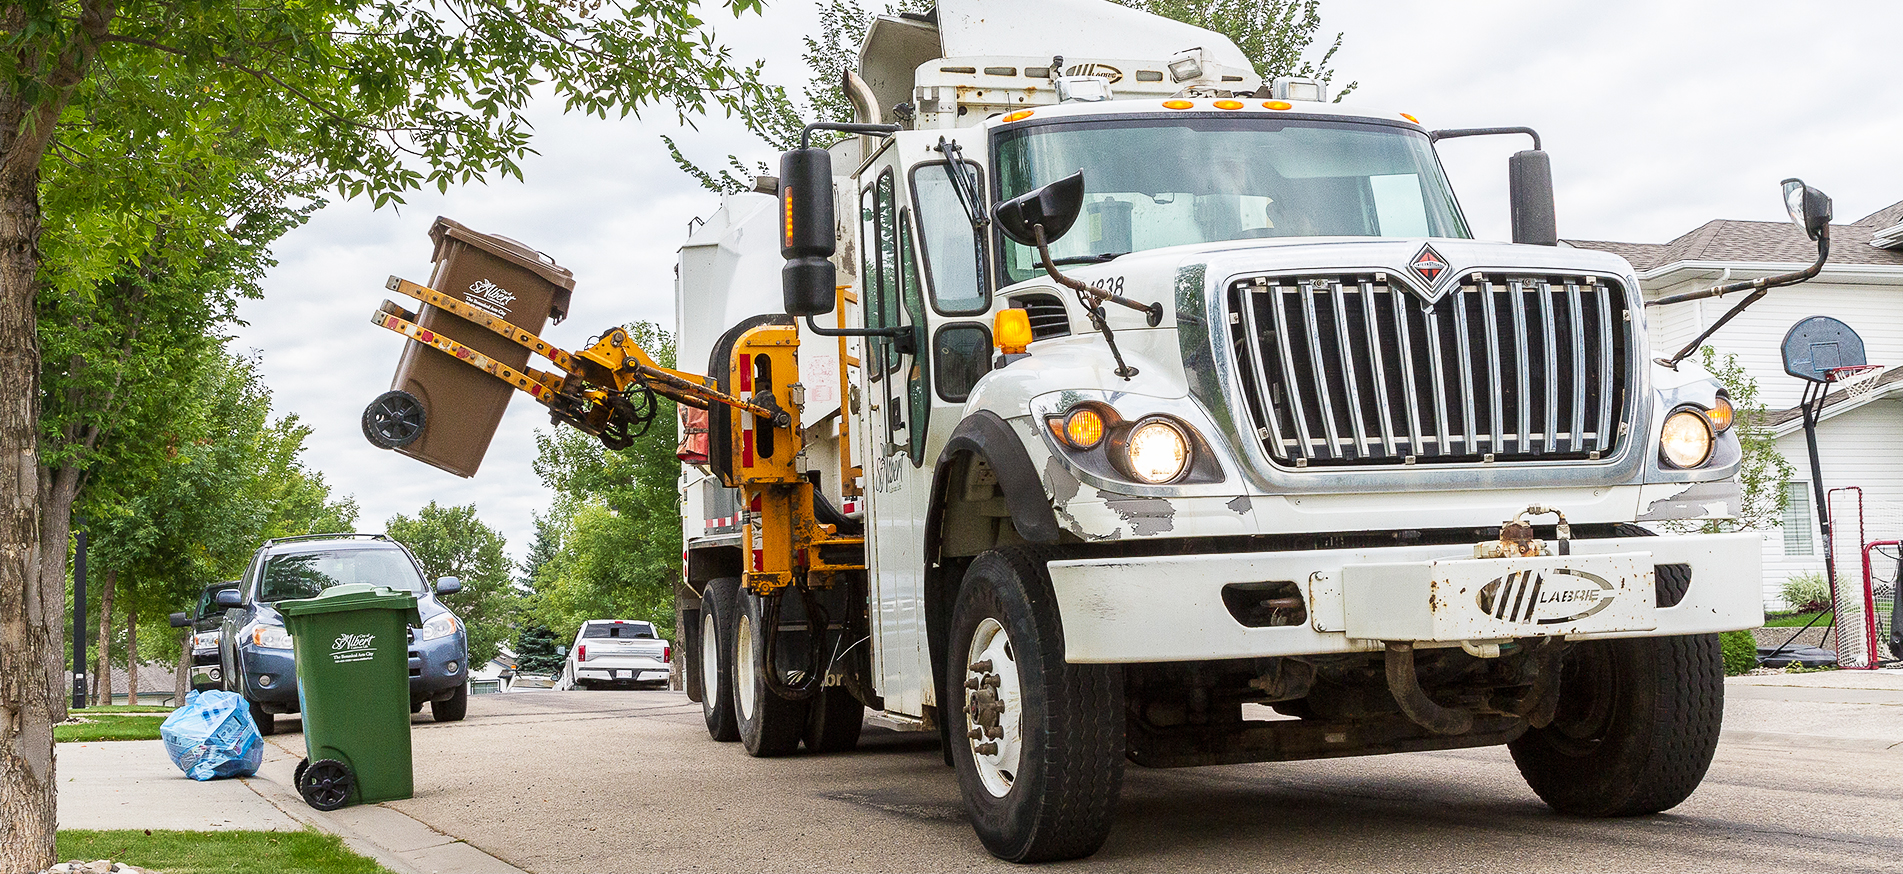
Residential Waste Per Capita
This indicator measures the amount of landfill-bound waste per St. Albert resident per year in kilograms.
Reporting frequency: Anually Last updated: 2019
Comments
The garbage per capita was 123 kg per person in 2018. This is consistent with previous years, however, the general public became more aware and interested in waste, recycling and waste reduction in 2018 as the topics were prevalent in the media. The City will continue to encourage waste reduction through daily habits and behaviours.
Water Consumption Per Capita
Measures the city's water consumption per capita per day. The water consumption value is composite in that it includes residential, industrial, commercial and institutional uses. The target of 200 litres/capita/day is to be achieved by 2020.
Reporting frequency: Quarterly Last updated: Q4, 2019
Comments
Q1: This value is calculated on the 2018 St. Albert census population of 66,082. The total volume of water consumption in 2018 was 5,567 ML (Million Litres). Q2: The 2018 Aggregate quarterly Average Day Demand (ADD) expressed in litres per capita per day (lcd) was 219.6(Q1), 237.5(Q2), and 236.9(Q3).Q3: It is observed that during the months of May/early June there is normally a higher water consumption compared to all other months due to water use for spring activities including street sweeping, residential lawn & garden irrigation and filling of residential swimming pools. Rational for the slightly increased annual lcd consumption compared to 2017 is in part due to the start-up of new schools, AGLC, new commercial business centers and associated water flushing that occurs in new development areas. Q4. Actions could include: continued communication and promotion of water conservation practices and application of the water conservation bylaw. Also, the new advanced water meter system and upgrades to the MyCity portal anticipated for launch in 2019 will permit customers who choose to enroll, the ability monitor their consumption closely.
Related Pages
Last edited: June 24, 2022