Approved 2023 Budget Summary
Operating Budget
The 2023 Municipal Net Tax Requirement of $124.9 million results in an average 4.6 per cent property tax increase. This increase relates to the City’s commitment to being fiscally responsible by reducing spending to offset declining revenues and inflationary impacts. For an average house costing $450,000, this means an increase of $167 per year.

$167 (4.6%) tax increase based on the average cost ($450,000) of a St. Albert home.
Note: percentage shown has been rounded to the nearest decimal point.
The actual tax rate will not be finalized until May 2023 after the assessment roll is completed.
Tax Dollars at Work
The Operating Budget funds services such as snow removal, trail maintenance, transit, and recreation programs for residents. The annual budget is built to maintain those services at Council approved service levels. Efforts are also made to continue to optimize service delivery to ensure community needs are met.
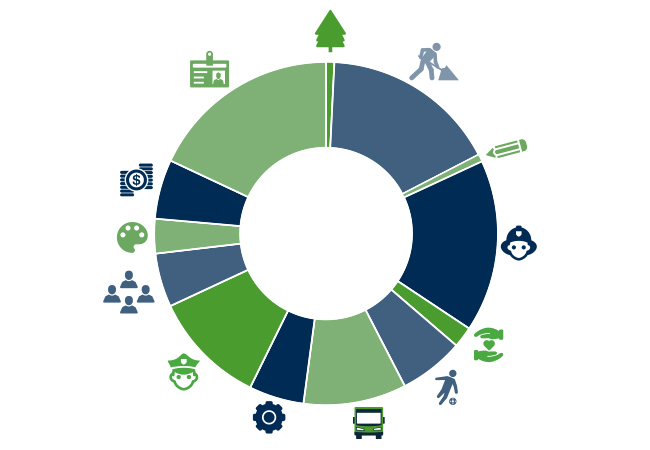
Distribution of Tax Dollars to Various Service Categories
For an average house valued at $450,000, the homeowner will see a $3,980 municipal property tax bill, an increase of $167 for 2023. The distribution of tax dollars to various service categories is illustrated below.
Excludes Provincial Education Levy, Homeland Housing Levy and utility charges.
![]() Environmental Sustainability: $28
Environmental Sustainability: $28
![]() Public Works: $658
Public Works: $658
![]() Planning & Economic Development: $62
Planning & Economic Development: $62
![]() Fire Services: $584
Fire Services: $584
![]() Family & Community Support Services: $78
Family & Community Support Services: $78
![]() Recreation & Parks: $180
Recreation & Parks: $180
![]() Transit Services: $374
Transit Services: $374
![]() Engineering Services: $199
Engineering Services: $199
![]() Police Services: $467
Police Services: $467
![]() Outside Agencies: $179
Outside Agencies: $179
![]() Culture Services: $102
Culture Services: $102
![]() Corporate Financing: $331
Corporate Financing: $331
![]() General Government: $738
General Government: $738
TOTAL = $3,980
Municipal Capital Budget
The Capital Budget provides for investments in infrastructure and capital assets such as constructing, buying or maintaining assets including roads, sidewalks, buildings, vehicles, equipment and land. This portion of the budget is important for critical maintenance of existing infrastructure and the future growth of our city.
For 2023, the municipal capital plan investment by asset category is illustrated below:

Civic Facilities: $5.2M

Historical/Cultural: $0.0M

Parks & Trails: $0.5M

Roads & Other Engineered Structures: $33.2M

Land & Land Improvements: $0.9M

Master Plan, Studies & Other: $0.4M

Mobile & Other Equipment: $8.7M

40 Projects
Total: $48.9M
Utility Budget
Utility Rate
The Utility Rate funds the operating and capital costs for water, waste water, stormwater, and solid waste programs that support St. Albert’s ability to provide clean, safe drinking water to its residents, as well as protect the natural environment through waste water treatment, stormwater and solid waste management.

$5.23 (3.8%) rate increase based on the typical monthly household utility bill ($144.24).
Distribution of Utility Bill
The typical monthly bill for 2023 is $144.24, an increase of 3.8 per cent from the prior year. The allocations of monthly rates are as follows:
![]() Waste Water: $46.89
Waste Water: $46.89
![]() Water: $43.35
Water: $43.35
![]() Stormwater: $20.92
Stormwater: $20.92
![]() Solid Waste: $33.08
Solid Waste: $33.08
![]() Total: $144.24
Total: $144.24

Related Pages


Last edited: December 21, 2022